

With the recent CPI data released on Friday, 11 September, markets price in a rate hike. CPI rose 0.4% in August, and 3.4% in the last 12 months.
Moreover, this data has led many to expect FED consensus to trigger a rate rise at the next FOMC meeting. Finally, within a week, the probability of rate hike on FedWatch rose from 60% to above 85% as of 13/9/26.
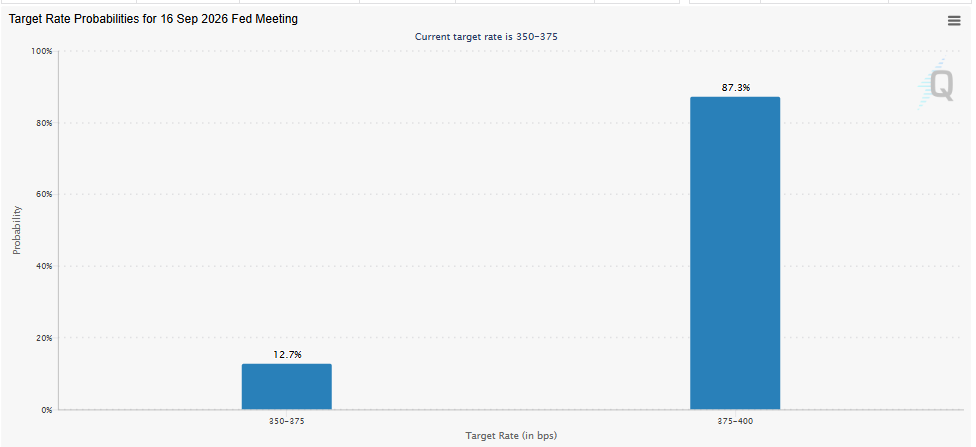
Source: https://www.cmegroup.com/markets/interest-rates/cme-fedwatch-tool.html
With that being said, I felt considering the potential arguments for why the FED might hold rates would be interesting. After all, with such data, why would the markets still price a 13% chance of holding rates? Something worth considering is that the European Central Bank already hiked rates in September and June in the face of price pressure amid the ongoing US-Iran war. Though both began from different starting points and macroeconomic conditions, it is still something interesting to consider. This is in no way investment advice; the most valuable calls come from going against consensus and being right. It is important to understand both sides to make a better-informed decision and stance.
1. What the Data Shows
I’ll focus on the 3 key figures at the crux of the argument. CPI, PCE and PPI. Briefly running through what each of it actually means and showed. Firstly let’s dive into the figures.
CPI measures what consumers actually pay at checkout. Headline CPI rose 0.4% in August, putting the 12-month rate at 3.4% — in line with consensus. Core CPI, which strips out food and energy, rose 0.3% for the month against a forecast of 0.2%, with the annual rate easing slightly to 2.4% from July’s 2.5%.
PPI measures prices at the wholesale level — what producers charge each other before goods and services reach a consumer. Headline PPI rose 0.4% in August, pushing the 12-month rate to 5.4%. Core PPI, however, rose just 0.2%, missing the 0.3% forecast.
PCE is the Fed’s own preferred inflation gauge, released with a lag — July’s reading, out August 26, is the most recent one available heading into this meeting. Core PCE came in exactly in line with consensus at 3.3% year-over-year.
2. What it could mean
PPI is generally considered a leading indicator. An interesting way to look at producers considering them as aggregators of inputs (i.e Energy, raw materials and labour) . While this is not inherently true for all producers, broadly speaking they are the first ones that face upstream pressures. They generally operate at a larger scale with lower margins. Therefore, sudden increments to price can rapidly shrink their margins. They may be able to absorb it temporarily, but it usually quickly gets passed on to the consumers.
From what we saw in the PPI numbers, headline was 0.4% higher than the previous month while core PPI was 0.1% lower than consensus This clearly shows the magnitude of effect from that these volatile energy and food prices had on the overall PPI numbers namely diesel which increased 24.1%. This supply shock in diesel was largely due to the US-Iran conflict driving crude oil prices up (“raw energy”) alongside refineries disruptions/ limitations causing crack spread to increase. One could argue that this could be considered a transitory supply shock. If so, rising rates into a temporary supply shock may not actually fix the issue, while accepting the negative trickle-down effects on the economy, or in other words raising rates into what could potentially be a decelerating issue.
Looking toward the CPI and PCE numbers, neither confirms second-order effects yet. What I mean by this is that oil and fuel are inputs for nearly every industry and is considered the bedrock of the economy . Think about transportation, manufacturing, agriculture, logistics. What we should expect a broadening energy shock should, in theory, show up as pressure across a wide range of unrelated categories, not just the most striaghtforward ones, yet this wasn’t exactly what we saw. Headline CPI came in at 0.4% for the month, exactly matching consensus, with gasoline alone accounting for over a third of that increase. If the logic of “oil touches everything” were already playing out, you’d expect to see that third of the increase joined by broader pressure elsewhere in the basket, which is what core CPI is supposed to capture. Yet we saw, core CPI’s miss was narrow: 0.1%, concentrated in a handful of categories (cell phone plans, hotels etc.) that have minimal/ no obvious connection to energy costs at all.
3. Potential supporting reasons
As a secondary consideration, political and fiscal backdrop could add some weight to the case for caution, though the Fed is independent and would never cite directly. On the fiscal side, federal debt just crossed $40 trillion, with annual net interest costs now exceeding the entire defense budget. Moreover, the Treasury just doubled its debt buyback program in August specifically to push yields back down, while not as aggressive as people had anticipated, a hike still works directly against that effort, adding to a cost the government is already straining to manage. Moreover, we are also seeing issuance from ai- companies which are also vying for investors capital. If the FED raises rates the credit spreads may widen forcing these ai spenders to scale back on build out projects or offer higher yields to narrow the spread – which increases the likelihood of the issuer defaulting.
On the political side, this decision is before the midterms, with the Trump administration publicly and repeatedly pushing for lower rates, not higher ones. Trump and the treasury may strong arm against a hike. Historically though, a Fed that visibly caves to a president’s demand for easier money hasn’t ended well as Arthur Burns did it for Nixon in 1972, and it’s widely blamed for the 1970s inflation Volcker later had to crush. That’s why a hold, not a cut, may be the safer political move here: it avoids hiking into an election, without looking like it’s caving to pressure the way a cut would.
4. Why a rate hike is still more likely
Read this article by MSN: Goldman Sachs, JP Morgan expect September Fed hike as inflation lingers
Sources
Axios. (2026, August 25). Big tech’s borrowing binge gives Treasury bonds competition. https://www.axios.com/2026/08/25/ai-debt-treasury-yields
Board of Governors of the Federal Reserve System. (2026). Summary of economic projections. https://www.federalreserve.gov
CME Group. (2026). CME FedWatch tool. https://www.cmegroup.com/markets/interest-rates/cme-fedwatch-tool.html
CNBC. (2026, August 26). Fed’s preferred inflation gauge shows core prices rose 3.3% annually in July. https://www.cnbc.com/2026/08/26/feds-preferred-inflation-gauge-shows-core-prices-rose-3point3percent-annually-in-july.html
CNBC. (2026, September 10). PPI inflation report August 2026. https://www.cnbc.com/2026/09/10/ppi-inflation-report-august-2026.html
CNBC. (2026, September 11). CPI inflation report August 2026. https://www.cnbc.com/2026/09/11/cpi-inflation-report-august-2026.html
Federal Reserve Bank of Dallas. (2026, February 10). How AI debt financing impacts duration supply and interest rates. https://www.dallasfed.org/research/economics/2026/0210-searls-aifinancing
Fortune. (2026, August 29). AI hyperscalers issuing a flood of bonds are ‘reverse crowding out’ the Treasury as US debt soars. https://fortune.com/2026/08/29/us-debt-reverse-crowding-out-effect-ai-hyperscaler-bonds-treasury-yields/
Kiplinger. (2026, September 11). August inflation data keeps a September rate hike in play: What to know. https://www.kiplinger.com/investing/economy/cpi-report-august-2026-what-to-expect
NBC News. (2026, September 11). Inflation ticked up in August, setting the stage for the Fed to hike interest rates. https://www.nbcnews.com/business/economy/august-inflation-interest-rates-affordability-rcna597095
U.S. Bureau of Economic Analysis. (2026, August 26). Personal income and outlays, July 2026. https://www.bea.gov/news/2026/personal-income-and-outlays-july-2026
U.S. Bureau of Labor Statistics. (2026, September 10). Producer Price Index news release, August 2026. https://www.bls.gov/news.release/ppi.nr0.htm
U.S. Bureau of Labor Statistics. (2026, September 11). Consumer Price Index news release, August 2026. https://www.bls.gov/news.release/cpi.nr0.htm
U.S. Bureau of Labor Statistics. (2026). Employment Cost Index, second quarter 2026. https://www.bls.gov
U.S. Bureau of Labor Statistics. (2026). The employment situation, August 2026. https://www.bls.gov
Vanguard. (2026). The AI buildout comes to the bond market. https://corporate.vanguard.com/content/corporatesite/us/en/corp/vemo/ai-buildout-comes-to-bond-market.html
Yahoo Finance. (2026, August). AI is driving up Treasury yields: ‘It just touches everything’. https://finance.yahoo.com/economy/policy/articles/ai-driving-treasury-yields-just-093000747.html
About the Author